Property tax bills just went out in Prince George’s County, and they’re right around the state average, but it’s still a lot to handle, especially with schools and public safety eating up most of the budget. Plus, with rising costs and new spending initiatives on the horizon, it looks like our tax bills might be climbing even higher soon.
Here are the highlights:
- Prince George’s County property tax bills cover various local and state services.
- The county’s tax rate is $1.00 per $100 of assessed value, close to the Maryland average.
- Bowie residents benefit from a lower city tax rate of $0.40 and a $0.14 county discount for local services.
- The county’s budget primarily funds education, public safety, and infrastructure.
- Education spending is significant, with $20,000 per pupil, yet student outcomes remain low.
- Maryland’s Blueprint for the Future initiative aims to improve schools but faces funding challenges.
- Suggestions for addressing high costs include exploring sales tax adjustments and rethinking public employee compensation.
- Increasing the supply of affordable housing could alleviate financial strain on local workers.
- Future discussions will focus on housing and education costs.
Stay informed
Sign up for my newsletter and join more than 3,500 of your Bowie neighbors getting regular updates directly from Mayor Mike.
All About Property Taxes
Prince Georgians began receiving their county property tax bills last week (suppressed groans).
The tax bill is paid to Prince George's County and covers property taxes for the county, the City of Bowie, Maryland National Capital Park and Planning, and the State of Maryland.
At $1.00 for every $100 of assessed property value, Prince George's tax rate is on par with the Maryland average of $1.01. The highest rate is Baltimore City's at $2.248, and the lowest is Montgomery County's at $0.67.
Bowie's city tax rate of $0.40 is on the low end for Prince George's County municipalities. Neighboring Laurel's is $0.71 and Greenbelt's is a whopping $0.82.
Maryland National Capital Park and Planning tacks on $0.29 for the parks and facilities in its jurisdiction, and the State of Maryland takes another $0.11.
Bowie residents receive a $0.14 reprieve from the county for city services the county would otherwise provide. This is namely for Bowie's local police department. Combined, Bowie residents' total tax bill is $1.68 for every $100 of assessed property value.
This leaves a typical Bowie home assessed at $400,000 paying $6,720 annually. See the complete list of Maryland county and municipality tax rates for 2023-2024.
Prince George's County
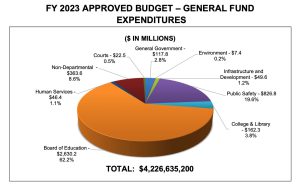
Where does all the county money go? Mostly schools. Just under two thirds of the county's $4.2 billion budget pays teachers, contributes to employees' pensions and healthcare, and funds the maintenance of the county's 209 public elementary, middle, and high schools.
Half of the school system's $2.6 billion budget is subsidized by the State of Maryland. Of note, $869 million covers salaries for the county's nearly 10,100 teachers, a 7.7% increase from 2022. $339 million is dedicated to Special Education and $124 million covers student transportation.
$371 million of the county's funds go to public safety, an increase of 10% over 2022. The additional funds are intended to support signing bonuses for 100 new officers, additional license plate readers, and community-based outreach programs. The county employs 2,110 police and support personnel.
$240 million, a 12% increase, goes to Fire and EMS, with new funds focused on improving real-time performance analytics, new gear for volunteer firefighters, smoke detectors for low income residents, and recruiting 75 new firefighters. County Fire and EMS maintains 1,068 personnel.
The remainder of the county's budget covers infrastructure, social services, county courts, the library system, environmental programs, and general government. A detailed county budget overview can be found here.
City of Bowie
The City of Bowie's budget, funded mostly by its $0.40 property tax, covers public works, community services, police, IT, finance, and planning and sustainability.
With an $18 million budget, Public Works provides trash and recycling pickup, leaf collection, local road, sidewalk, curb and gutter maintenance, street light repairs, and snow plowing and salting operations. They also manage the city's water and sewer system and engage in year-round infrastructure projects.
At $15 million, Community Services oversees Animal Control, Code Compliance, and youth and family counseling. They manage the city gymnasium, ice arena, Bowie museums and historic properties, city playhouse, senior center, and the city's many public parks, ballfields, and outdoor courts. This department also organizes the city's major special events.
The Bowie Police Department, with its $14 million budget, is responsible for investigating non-felony crimes in the city. They collaborate with the county on felonies. They staff the city's 24/7 dispatch and non-emergency call center, manage the city's speed camera program, and conduct regular public outreach events with the city's Public Safety Committee. They manage the city's camera rebate program, Explorer's group, and Citizens Police Academy. They also participate in regular training events, CALEA accreditation programs, and publish crime reports.
Information Technology operates with $3.9 million, providing the system and network administration that supports the rest of the city. They work to automate day-to-day processes and protect the city from ransomware and Denial of Service attacks against city infrastructure.
At $1.4 million, the Finance Department monitors and controls the flow of city revenues and expenditures. They develop the city's annual budget, assemble regular financial reports, work with the city's Financial Advisory Committee to help communicate budget matters to the public, and administer the city's water and sewer finances.
With $0.9 million, the Planning and Sustainability Department manages the city's permitting and development review process. They work to protect the city's green spaces and wetlands, and provide administrative support to the city's many environmental initiatives. They also develop the city's trails, complete streets, placemaking, and development policies.
Maryland National Capital Parks and Planning Commission
M-NCPPC takes in nearly $25 million from Bowie households and maintains additional neighborhood parks and playgrounds, athletic fields, historic sites, recreation facilities and 165 miles of trails county-wide.
In Bowie, they manage the Huntington, Sussex Lane, and South Bowie Community Centers, about two-thirds of the local neighborhood parks, and several hiker and biker trails. They also provide planning and development review services, having recently completely the Bowie and Vicinity Master Plan update in conjunction with the City Planning Department.
Future Outlook and My Personal Take
Comparing counties. Comparing county and state tax burdens can get tricky. It's often said that Prince George's has the highest property tax rate of any Maryland jurisdiction outside of Baltimore. This falls pretty squarely in the myth category.
At $1.00 for every $100 of assessed property value, Prince George's is within the state average of $1.01, well below Baltimore City's $2.24, and shy of Charles County's $1.14 and Frederick's $1.06. It remains nearly even with Howard's $1.01 and Anne Arundel's $0.98.
Often compared are the Prince George's and Montgomery County tax rates. At $0.67, Montgomery maintains the lowest property tax rate in the state, though they can afford it with some of the highest assessed property values in the country.
For comparison, the median assessed value of a Prince George's County home in 2021 was $327,000. For Montgomery County, it was $483,000. Average household income in Prince George's County was $86,000 that year and stood at $111,000 in Montgomery.
Added to the difference in household number and the amount and value of commercial real estate, it's not hard to see how Montgomery County's $0.67 tax rate can fund its $6.8 billion budget while Prince George's $1.0 rate supports only a $4.2 billion budget.
Why is everything so expensive? There's no arguing that the cost of state, county, and even city government has gone up significantly. Some of this can be attributed to simple inflation. A reliable trash truck that cost $120,000 four years ago costs nearly $220,000 today.
The biggest expense in any organization's budget, especially government's, is salaries and benefits. $365 million of the county's expenses cover just fringe benefits, including employee healthcare and pensions, which continue to grow at a significant clip. Coupled with automatic cost of living adjustments, county employee overhead is rising 11% year-to-year.
Many ask whether all this spending makes a difference. A major gripe in many jurisdictions is no amount of money seems to make a difference in public service outcomes. Focusing on education, the largest expense in the state and county's budgets, a difficult reality is that money and learning outcomes aren't necessarily correlated.
Despite record education spending, Maryland still has thousands of teacher and support staff shortages, remains plagued with complaints that its more junior employees are underpaid, and is producing worst scores in literacy and math than at any point in 22 years, a decline that preceded even the pandemic.
Prince George's spends $20,000 per pupil in county public schools. Maryland as a whole averages $16,000 per public school pupil statewide. This is far less than New York's $26,000, but still more than Arizona's $9,600 or Utah's $9,100. One would think that spending would bear some connection on leaning, yet Maryland ranks a low 42nd in student test scores. New York ranks 46th. Florida, spending $10,400 per pupil, ranks 4th.
Years of data show only a slight connection between education spending and student learning. Public education costs are often more a product of the cost of labor, land, and material. Some states place a higher premium on rules governing maintenance and construction contracts. Those states tend also emphasize higher labor standards and enter more generous public contracts.
All of these factors result in higher costs borne by taxpayers. But they have relatively little impact on student success.
More expenses are on the way. In Maryland, state lawmakers have been embarked in recent years on a major new schools initiative, the Blueprint for Maryland's Future. In short, it represents billions of dollars in new spending to make a third of Maryland's schools double as community social support hubs, increase teacher pay and retention, and significantly expand affordable pre-K education. It's a serious plan with genuinely noble goals. It's also already running into major funding challenges, competing with the ever growing costs of existing public pensions, worker benefits, and existing school maintenance and construction backlogs.
It also continues to presuppose dramatic new school spending will improve student achievement. Plenty of experts argue the Blueprint's efforts to address student needs outside the classroom, including basic preventative healthcare and affordable earlier learning, will help student achievement for Maryland's most marginalized learners. It very well might.
But it's also worth remembering that 41 other states manage to produce higher literacy and math results despite, on average, lower public education spending. It's also worth pointing out is that past hopes about new sources of school revenue fell far short of expectations. Not long ago, casino and liquor taxes were touted as major new revenue sources to buoy public education. Last year, it was taxed legal cannabis. While taxes on casinos, alcohol, and cannabis do bring in new revenue for education, it's a paltry sum compared to the need, and has so far not helped produce promised learning results.
What is certain is the Blueprint will add significant costs to already thinly stretched public budgets. The timing is especially challenging as Maryland's recent budget surplus, the results of generous federal pandemic spending, has already bottomed out, giving way to a projected $400 million deficit next year. Simply maintaining existing service levels, even before undertaking significant new education programs, will require some combination of higher state income, property, and sales taxes.
Lawmakers will also likely face pressure to expand tax credits for retirees, veterans, and groups for whom its expeditious to reduce tax burdens. For others, the tax lift will get heavier.
Perhaps new spending will make a difference this time. New Jersey, with its $2.26 average property tax rate, $9,700 for an average single family home, ranks 10th nationally by some education metrics. Massachusetts, ranked 2nd, averages a $2.25 property tax rate, $13,500 for a typical Bay Stater.
Though given past attempts in Maryland resulted in higher spending, more taxes, and, somehow, worse results, one could understand skepticism about the new plans.
Possible Solutions
Sales taxes are a deeply under-appreciated revenue mechanism. They can be reduced for essential goods and services, like groceries; applied more heavily on those favorite of taxed activities, like smoking, drinking, and gambling. Or they can simply be avoided by more frugal choices, such as staying in, cooking at home, not purchasing a second yacht.
Plenty of economists and organizations with words like "commerce" in their name raise many good objections to higher sales taxes. Many in the business community went apoplectic when the state, facing its last major financial crisis, raised sales taxes in 2008 to its current 6% rate. A slightly higher sales tax wouldn't be a panacea, but would go a long way in generating new revenue without placing all of the burden on property tax rates.
Another idea is to rethink how we compensate state and county workers. Bowie, despite facing all the same inflationary challenges of other jurisdictions, has maintained a constant, and comparatively low, property tax rate despite significant growth in its public services. We still enjoy a 14 cent county tax discount for our police department, one we never had to offset.
Our secret? We don't offer pensions to most workers. We're consistently in the top 25% of municipal salaries. We offer competitive employer-matched contributions to private retirement funds. We offer healthcare benefits. But we don't promise a portion of workers' salaries for life.
It may sound callous, but no financially responsible organization offers pensions in 2023. For one thing, workers are less interested in them, opting more for jobs with higher starting salaries. The public sector is badly behind the times, and it's showing in the difficulty of state and county governments to recruit essential workers.
For another, pensions are a financial black hole. Employees work fewer years relative to the length of their retirements. They also change jobs now more than ever, often only working ten years before being vested in the state retirement system. The number of active workers contributing to the system is declining against the number of retirees the system supports. Taken together, it's not hard to see how record state and county spending gets sucked into pensions while so little makes its way to immediate day-to-day needs.
This is how local taxpayers can be charged $6,720 in property taxes, and thousands more in state income and sales taxes, and still have schools with too few teachers and public facilities perennially in disrepair.
Another suggestion is to tackle the cost of housing. A lack of attainable housing has long been a complaint of critical workers, especially teachers, who are increasingly choosing better paying professions, or opting to teach in more remote communities where housing is less expensive relative to their pay. The good news is there's no complicated formula for this one. Decades of data on housing policies across the US and abroad have come up with a simple axiom: If you want affordable housing, make it easier to build affordable housing.
When there's more demand for housing than supply, as with most other things, the price goes up. At the moment, the Mid-Atlantic is experiencing significant housing demand, and the market for new homes isn't keeping up. Locally, Bowie property values went from the mid $200,000s to the mid $400,000s in just seven years. That's a giant red flag signaling a massive demand-supply imbalance.
The county, embarked on a recent rent control endeavor, can disincentives landlords from improving their rental properties, but they can't lower the bottom line cost of new housing with more rules. The county should focus instead on addressing their beleaguered permitting office which is notorious for taking years to approve basic permits. The county council can update land use rules to make it easier to build denser housing; think duplexes and fourplexes more than skyscrapers.
By increasing the supply of affordable housing, governments will have an easier time attracting local workers. With more attainable housing on the market, critical service sector employees will have an easier time living closer to where they work. They will also be less financially strained when negotiating taxpayer-funded salaries and benefits. The other benefit is additional housing means additional property tax payers offsetting the tax burden on existing residents.
Future articles will discuss more on housing and higher education costs. For now, I will leave it at taxes are high and are poised to get higher. You, the voter, have a great deal of influence in talking to your lawmakers about these issues. I hope I've been able to supply you with some useful information. If you made it this far, thank you for reading! As always, questions and thoughts are welcome at mesteve@cityofbowie.org.
For reference
https://dat.maryland.gov/Documents/statistics/TaxRates_2023-2024.pdf
https://www.princegeorgescountymd.gov/DocumentCenter/View/43138/Budget-In-Brief—FY-2023-Approved-Budget
https://www.cityofbowie.org/ArchiveCenter/ViewFile/Item/4173
https://www.census.gov/newsroom/press-releases/2023/public-school-spending.html
https://www.nationsreportcard.gov/profiles/stateprofile?chort=1&sub=MAT&sj=&sfj=NP&st=MN&year=2022R3
https://blueprint.marylandpublicschools.org/